WorldQuant International Quant Championship
Creating alpha strategies for portfolio construction
From late March through summer 2023, WorldQuant is running its annual International Quant Championship.
The competition runs on WorldQuant’s 🧠 BRAIN platform, which hosts over 85,000 data types, hundreds of operator functions, and a custom backtesting simulator to test alpha ideas.
I’m happy to share that I placed 382/29,101 in the world (top 1.3%) and 20/1,191 (top 1.7%) in the USA during the 1st round. I placed 315/2,920 in the world (top 11%) and 12/100 in the USA for the 2nd round. The third round took the best candidates from each region, so unfortunately I did not qualify to advance. Go team USA 🇺🇸!
Competition rules
At its core, the WorldQuant International Quant Competition revolves around alphas: portfolio construction algorithms that assign weights to stocks in a given universe. Alphas specify how to reweight stocks each day using related data streams as input, like the prior day’s price, news, or company data. The WorldQuant Brain platform does the heavy lifting by simulating an alpha’s corresponding portfolio. Alphas that produce the highest and most stable returns receive high scores.
Alphas are individually scored with a secret formula that weights their Sharpe ratio, turnover, and a custom metric named “fitness.” Fitness is calculated as sqrt(abs(Returns) / max(turnover,0.125)) * Sharpe. This rewards alphas with a high Sharpe ratio and high returns with low turnover (a penalty for wildly varying day-to-day weights).
Scores from each submitted alpha are aggregated such that baskets of alphas with strong and uncorrelated returns are highly rewarded. All scores are based on a 5-year backtest ranging from 2016 to 2021.
Each stage in the competition pares down the field to fewer and fewer contestants. The first stage hosted over 29,000 participants. Cutoffs for the second round eliminated all but the top 100 contestants from each geographic region. Upcoming is the third round which pits the best contestants from each region against one another. Then, the final round is an in-person competition with cash prizes from a $100k pool 💰!
Generating alphas
WorldQuant generously hosted Q and A sessions with current quant researchers. I got the chance to interact with researchers from India, Korea, and China as they taught about topics from alpha neutralization (unbiasing alphas across different industries or sectors) to vector data fields (which provide more than 1 data point per day).
These webinars were the source of countless alpha ideas and tactics to improve performance. My 📝 webinar notes list out the alphas and tips shared by the researchers, as well as the answers to some of the questions asked by myself and the other participants.
I found WorldQuant’s articles to be fantastic sources of new ideas. My 📝 article notes show hundreds of the alphas I tested. For example, I tried every single one of the 📈 101 formulaic alphas. It took me over an hour, but I managed to find a few worth submitting!
A few alphas
Overall, I tested 1,103 alphas and submitted the 28 best for scoring. These involved data fields comprising price, volume, fundamental, and news information on stocks from the USA and China.
Alphas specify data, functions, and testing parameters. One especially important testing parameter is the neutralization, which allows for group-neutral portfolio construction. For example, market neutralization zeros-out our portfolio such that there is an equal weight of long and short positions across the market. This allows betting not on the overall momentum of the market, but rather the relative movements of stocks within the market. Other group neutralizations like sector, industry, and subindustry neutralization are possible too.
For more information about data, operators, and testing parameters, check out the WorldQuant Brain platform’s excellent 📑 documentation.
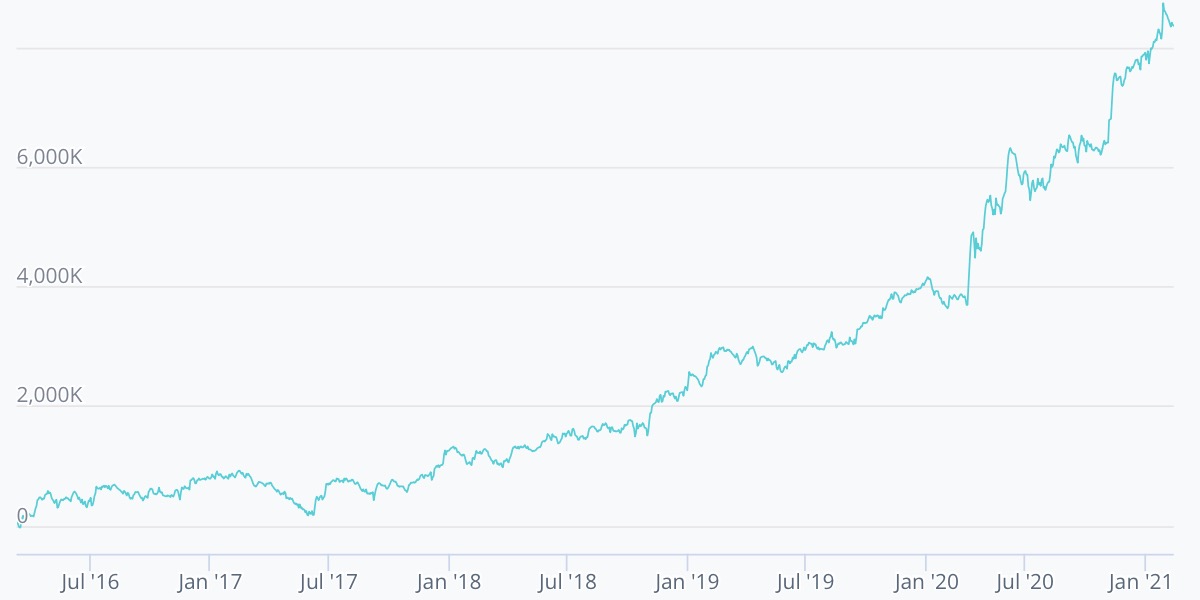
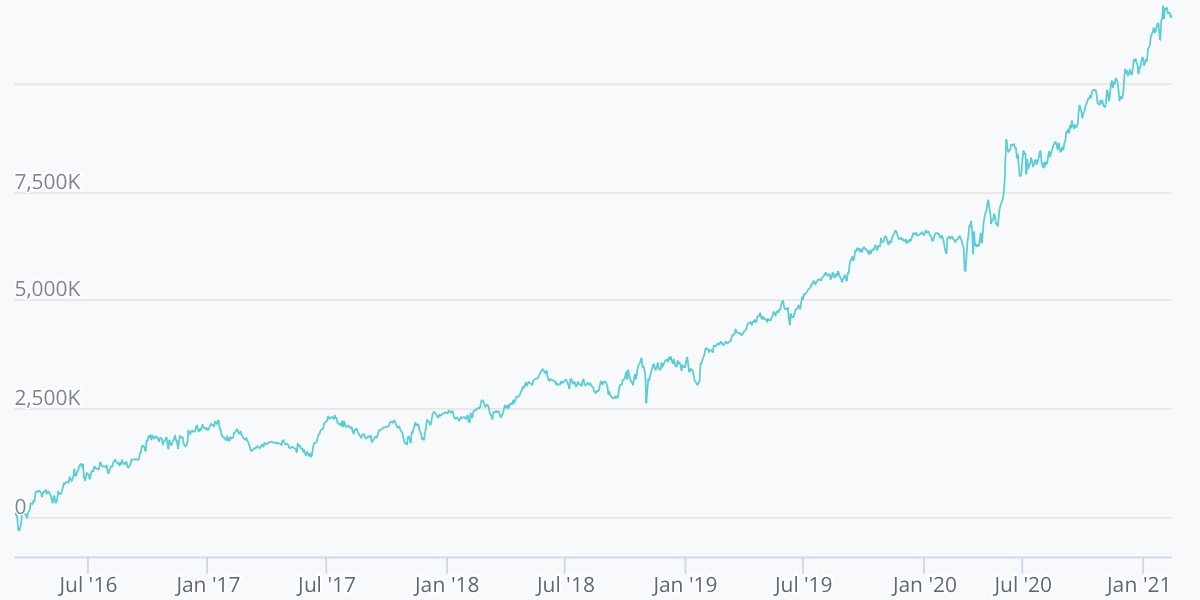
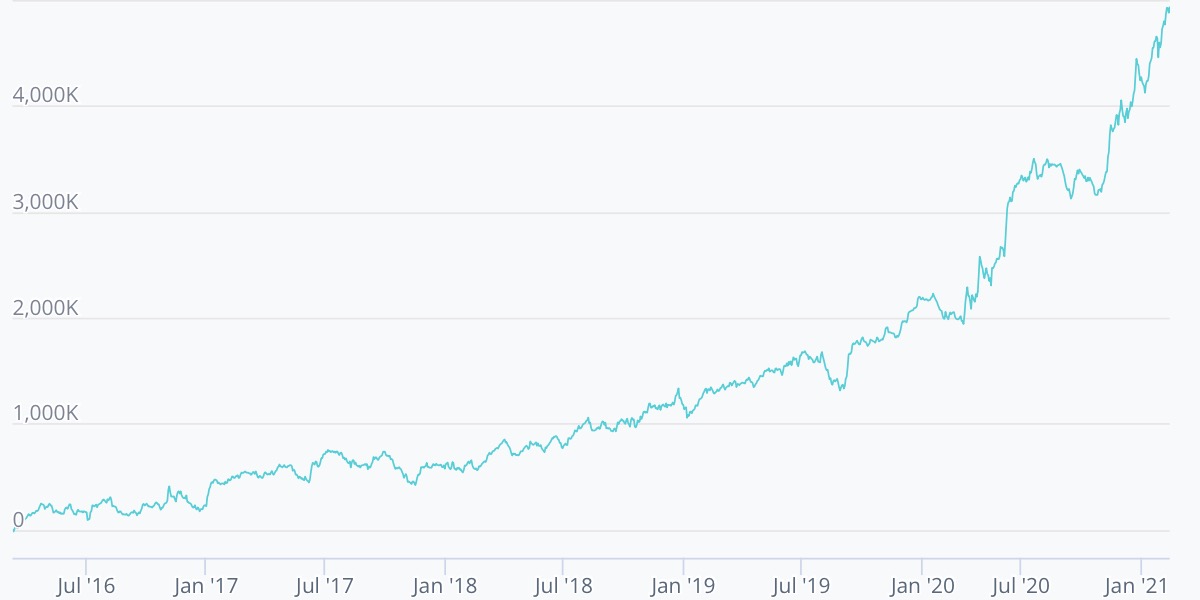
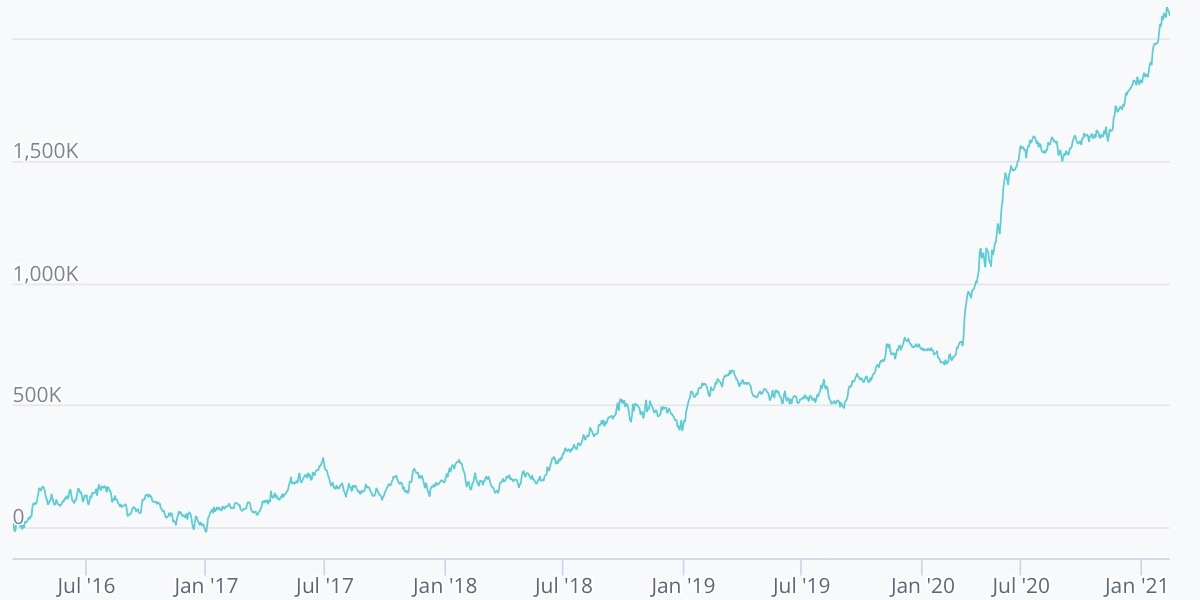
You can check out all of my 📈 submitted alphas in my notes on GitHub. Below are a few of my favorites. The graphs show the alpha’s profit on a $10M portfolio over a 5-year backtest from 2016 to 2021
(1) Simple price reversion
(high + low)/2 - close
- Parameters – Top 3000 stocks, market neutralization
- Idea – This is a super simple mean reversion idea! If the price went down at the end of the day compared to the average price, then buy the stock tomorrow.
- Performance – 1.80 Sharpe, 51% Turnover, 17% Annual Returns, 1.03 Fitness
- Notes – This alpha performs surprisingly well given its simple form. It has a high Sharpe ratio and annual return, but its sensitivity on day-to-day changes lead to a high turnover rate too.
(2) Complicated price reversion
rel_days_since_max = rank(ts_arg_max(close, 30));
decline_pct = (vwap - close) / close;
decline_pct / min( ts_decay_linear(rel_days_since_max, 1), 0.15)
- Parameters – Top 200 stocks, market neutralization
- Idea – Focus the simple price reversion strategy on stocks which have recently peaked. Note that
vwapis the volume-weighted average price, a more accurate measure of the average price. I used percentages to more fairly compare stocks and clamped the denominator at 0.15 to avoid overweighting just a few stocks. - Performance – 1.58 Sharpe, 49% Turnover, 23% Annual Returns, 1.09 Fitness
- Notes – We were able to boost annual returns even further by adding time data to the mix. Unfortunately, this didn’t decrease turnover though.
(3) Short overpriced companies
-ts_zscore(enterprise_value/ebitda, 63)
- Parameters – Top 3000 stocks, industry neutralization
- Idea – Short stocks with rising valuations above their earnings, compares to others within their industry. I rank the companies with a 63-day (single quarter) lookback to account for the most recent and prior reports.
- Performance – 2.00 Sharpe, 25% Turnover, 10% Annual Returns, 1.26 Fitness
- Notes – Finally, an alpha with lower turnover! This is due to the much more stable nature of fundamental data (which only changes quarterly) compared to price-volume data (which changes daily). Interestingly, testing a version with faster updated data earns a 2.58 Sharpe with 1.70 Fitness! This indicates that analyzing earnings reports as soon as they release can significantly improve a fundamental-based strategy.
(4) Hot news with reversion
avg_news = vec_avg(nws12_afterhsz_sl);
rank(ts_sum(avg_news, 60)) > 0.5 ? 1 : rank(-ts_delta(close, 2))
- Parameters – Top 3000 stocks, subindustry neutralization
- Idea – Buy stocks that are relatively newsworthy compared to peers within their subindustry. For the less newsworthy stocks, use a simple price reversion strategy. This mixes momentum (based on news) with reversion.
- Performance – 1.84 Sharpe, 9% Turnover, 4.29% Annual Returns, 1.08 Fitness
- Notes – This alpha performed especially well at the beginning of COVID, around March 2020. Perhaps the relationship between news and stock prices changed around then, coinciding with the newfound importance of trends in remote work, pharmaceuticals, and at-home entertainment.
(5) Too much buzz is bad
buzz = ts_backfill(-vec_sum(scl12_alltype_buzzvec), 20);
ts_av_diff(buzz, 60)
- Parameters – Top 3000 stocks, subindustry neutralization
- Idea – Short stocks that have increasing buzz compared to their average over the last 60 days.
- Performance – 1.94 Sharpe, 45% Turnover, 22% Annual Returns, 1.35 Fitness
- Notes – Similar to the prior alpha, this one performed especially well starting around March 2020. The social media buzz complements the news data, providing sufficiently uncorrelated returns to increase my overall score.
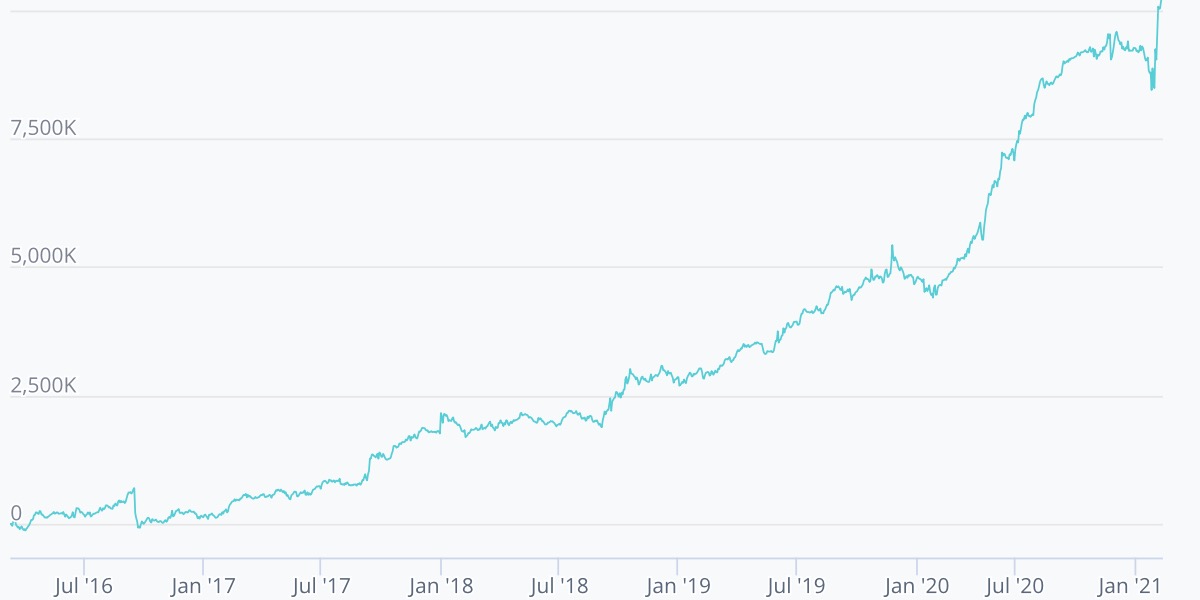
Overall, I found that price reversion strategies worked especially well for this competition. All of the above alphas incorporated some form of price reversion, either directly in alphas 1 and 2 or as part of a larger strategy in alpha 4. Reversion also appears in alpha 5 as a signal within social media buzz data.
In addition to price reversion, I also found success in leveraging the COVID pandemic’s effects on the market. Many alphas that performed OK pre-COVID shot to the moon 🚀 starting around March 2020. COVID clearly kicked off a new wave of trading activity that rewarded alphas based on news and social media buzz. Alphas like 4 and 5 performed especially well starting around 2020.
Conclusion
🎉 After months of researching and testing alphas, attending seminars, and reading articles, I am happy to have finished the 2nd round in the top 15 of the USA. I’ll certainly be following along to cheer on the USA team as it progresses into the 3rd round!
I had a great time learning about backtesting, alpha generation, and data exploration from some of the best quant researchers in the world. The tutorials, seminars, and recommended papers complemented each other very well.
I would like to thank WorldQuant again for putting together such a well-run and exciting event. I’m looking forward to another competition next year!