Neural Network Uncertainty
Final project for my Big Data Analytics class
Let’s explore my final project for the CIS545 Big Data Analytics class I took at Penn. Throughout the semester, we worked with review data on Amazon products. Our end goal was to many machine learning performance-boosting tricks, such as using bag-of-words features and employing PCA to reduce the dimensionality.
My project processes review data using gensim and implements a neural network (NN) in Keras to predict ratings and their uncertainties. I developed a simple metric to describe the confidence of NN predictions, finding that the NN tends to be most confident in its 1-star predictions.
You can follow along with this Google Colab notebook. The main idea is that the NN predicts scores for each star rating, rather than predicting a star rating directly. This lends itself well to uncertainty analysis – we can interpret the close calls as being less certain than the blowouts.
I found three main conclusions:
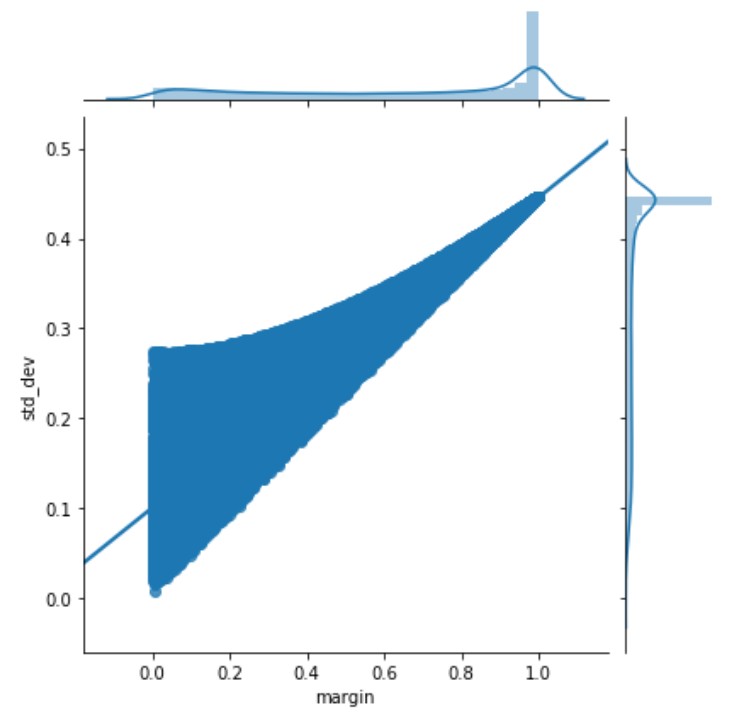
- The standard deviation of the scores and the margin (defined as the difference between the two highest scores) lead to similar conclusions. See their correlation in the left figure below.
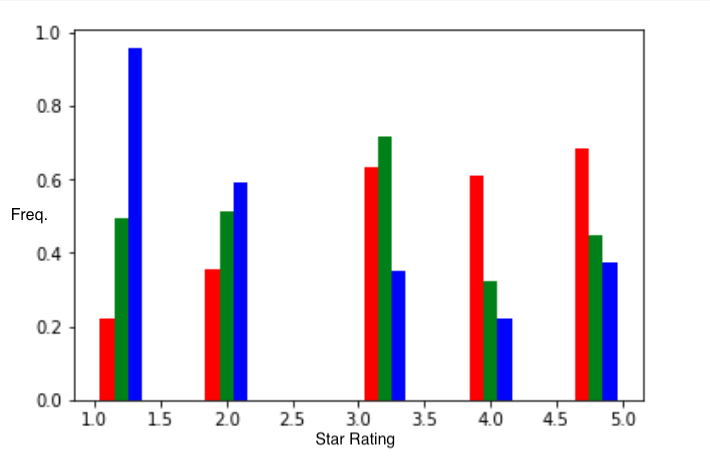
- The blowouts tend to exist mainly for negative reviews. The NN picks up on negative words like “bad”, “junk”, “mistake”, “unimpressed”, and “dirty” and makes a confident (and correct) prediction. See the middle figure below.
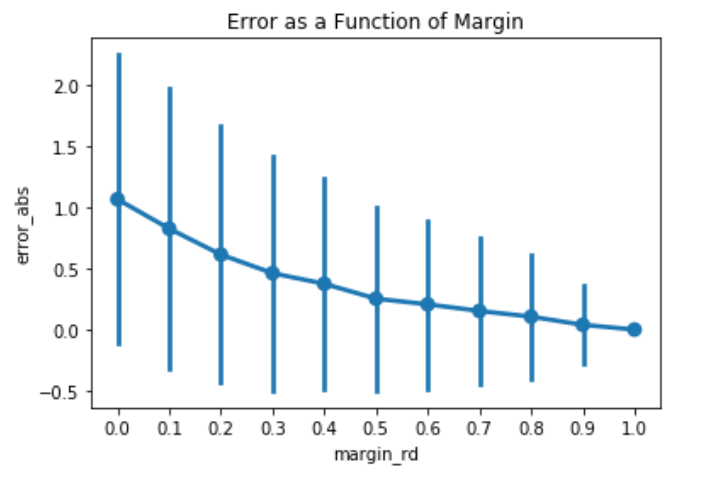
- The prediction error and margin are negatively correlated such that higher confidence implies lower error. In other words, the NN is precise AND accurate. See the right figure below.


These findings are encapsulated in the table below, which lists the prediction uncertainties for different margins. Now, we can apply this table to quantify uncertainties in the NN predictions! I show in the Google Colab notebook that this leads to fewer surprises, in which NN predictions are far from the actual scores.
| margin | error bar |
|---|---|
| 0.0 | 1.1 |
| 0.1 | 0.8 |
| 0.2 | 0.6 |
| 0.3 | 0.5 |
| 0.4 | 0.4 |
| 0.5 | 0.3 |
| 0.6 | 0.2 |
| 0.7 | 0.2 |
| 0.8 | 0.1 |
| 0.9 | 0.0 |
| 1.0 | 0.0 |